Climate
Guidelines for using graphs and other forms of data visualization
1) When a source contains a graph or some other kind of data visual, ask yourself if including this element in your story will enrich audiences’ understanding of climate change. Don’t add a graphic simply for the sake of having non-textual content.
DO THIS
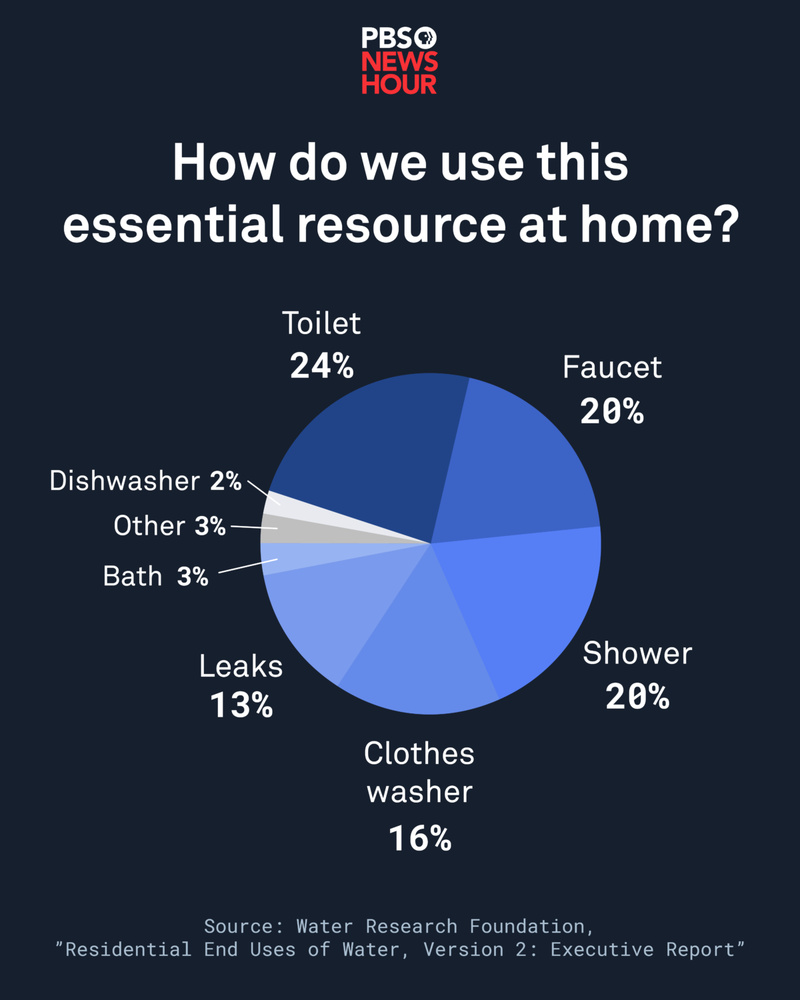
A story about rising global water scarcity breaks down how individuals use water to better identify ways to conserve the resource.
DON'T DO THIS
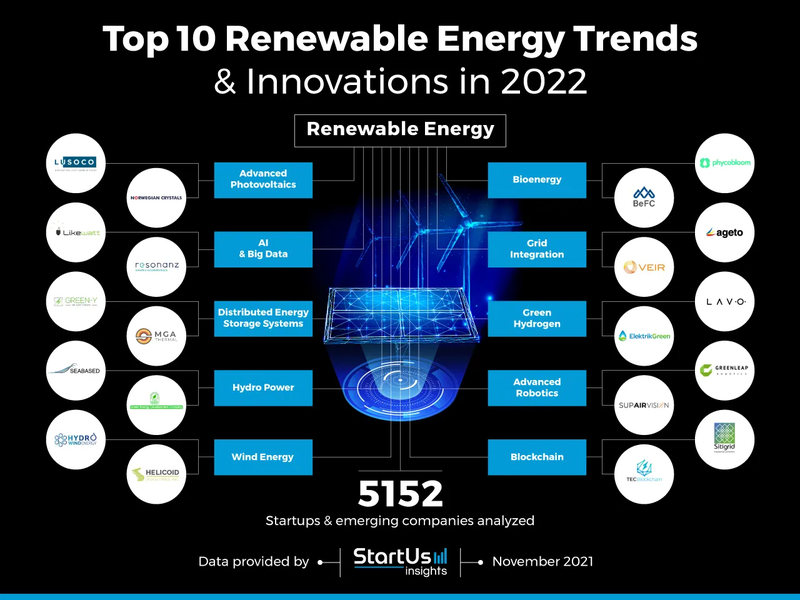
A story about technologies for fighting climate change includes a graphic (see below) highlighting the “Top 10 Renewable Energy Trends & Innovations in 2022.”
DISCUSSION
Many of the sources that serve as the basis for climate reporting (official reports, scientific journal articles, etc.) contain graphs, maps, and other kinds of data visuals. Incorporating these into news stories can benefit audiences, particularly when they illustrate a key point. This is certainly the case in the first example above. But sometimes, graphics are confusing and even distracting. The graphic in the second example comes from the data science and information company StartUsInsights. On the surface, the graphic appears to offer lots of information about companies in the renewable energy industry. In reality, there is not much that is helpful to readers here. In addition to being rather busy, the graphic doesn’t offer much information to audiences.
2) When using graphs, provide titles, clearly label axes, and properly cite sources of information
DO THIS
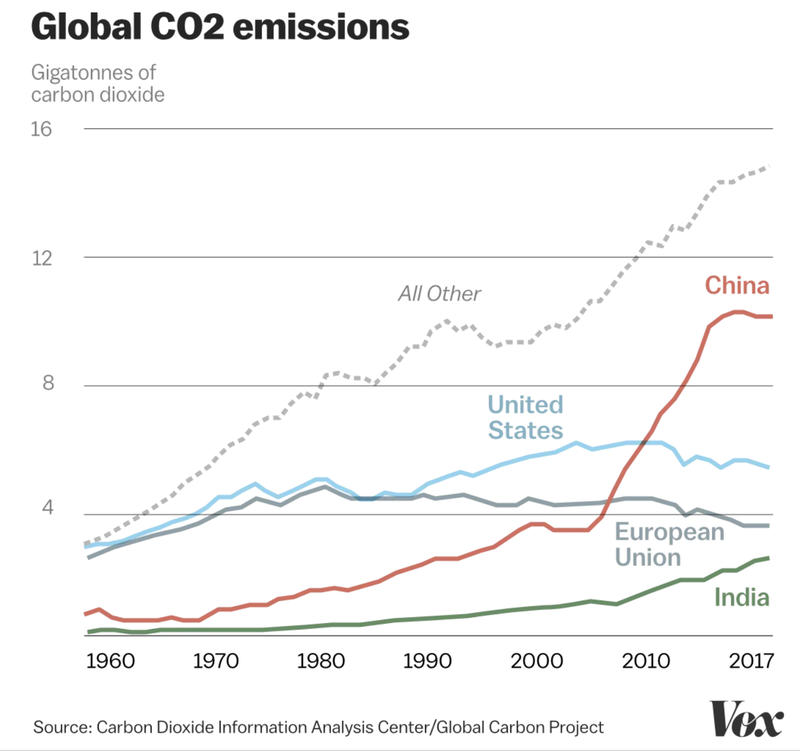
A story about global carbon dioxide emissions includes a graph (see below) with a clear title, appropriately labeled axes, and a citation.
DON'T DO THIS
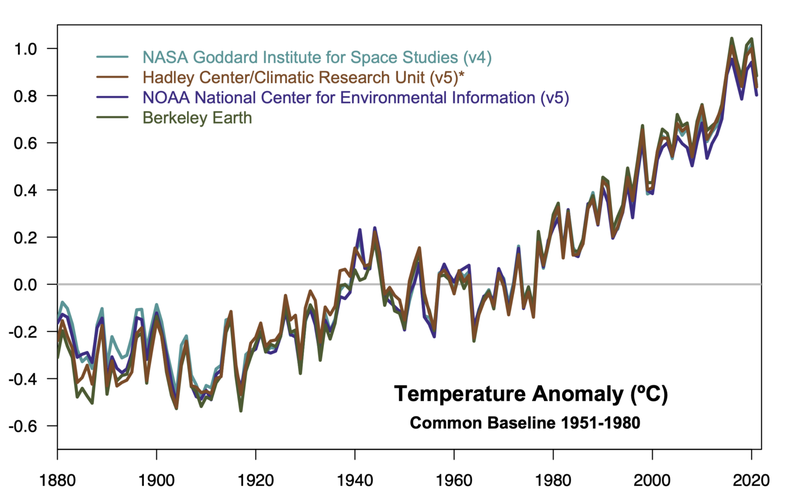
A graph (below) measuring temperature anomalies from the 1950s through the present lacks both a title and clear axis labels.
DISCUSSION
Labels and keys help a reader make sense of what they're seeing in a graph. When done properly, this information makes graphs accessible to a general audience, including those that don't have a robust background in interpreting data. The point of the graph is to visualize and build upon information that a reader has learned from the text of a piece, not to present entirely new information for them to process. Also the lines representing different collection centers are so close together, it’s almost impossible for a viewer to differentiate or get the point the graphic is trying to make. It would have perhaps been better to pick one source and then footnote and/or reference elsewhere in the reporting that other sources had similar numbers.
3) Use titles and captions to draw attention to the main point or key finding within the data you’re visualizing
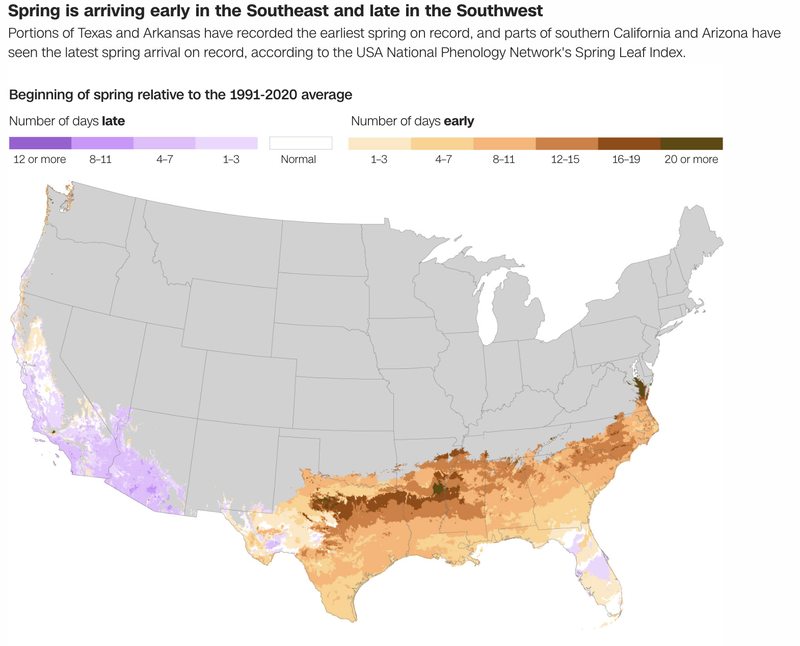
DO THIS
An article uses a clearly titled map to show how while the Southeast is seeing its “earliest spring in 40 years,” the Southwest is “seeing their latest start to spring in 40 years.”
DON'T DO THIS
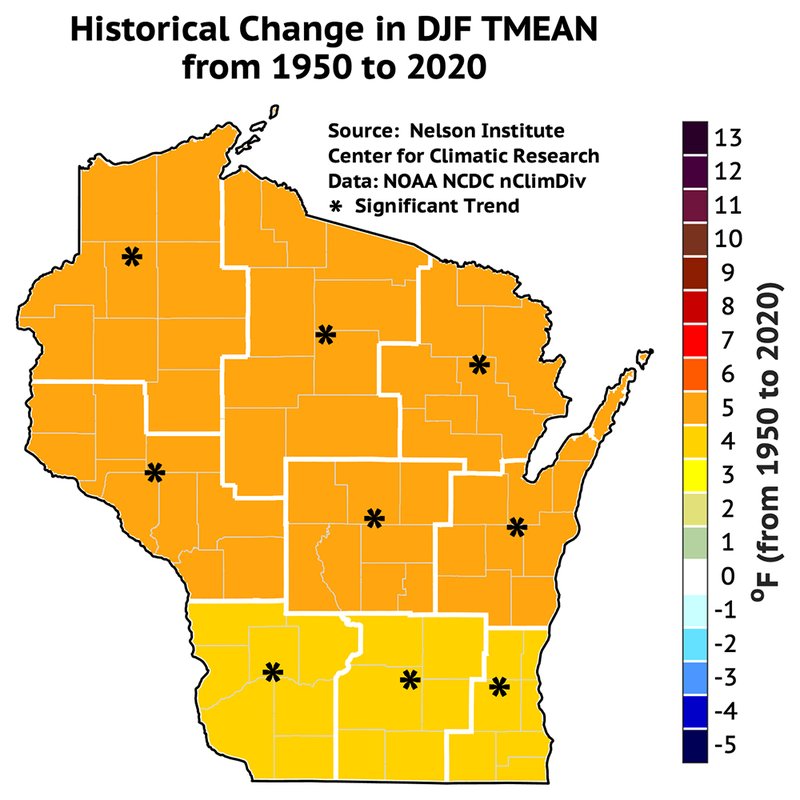
An article looking at warming winters in Wisconsin includes a map (see below) whose title is incomprehensible and conveys no information as to what is being depicted.
DISCUSSION
Titles, labels and descriptions can be the most important parts of any data visual. The title used in the first example (“Spring is arriving early in the Southeast and late in the Southwest") not only cues audiences into what is being measured, but makes the interpretation of this easier, by pinpointing exactly what the data indicates. You will almost always need to write a title different from the one that appeared in the original source–particularly when the source is a scientific study. The second example above fails to make this change, and the result is a title (“Change in DJF TMEAN, RCP45, 2041-2060 minus 1981-2010”) that is far too technical for the average reader to understand.
4) Make sure that captions, legends, and footnotes are all clear, comprehensible, and appropriately located.
DO THIS
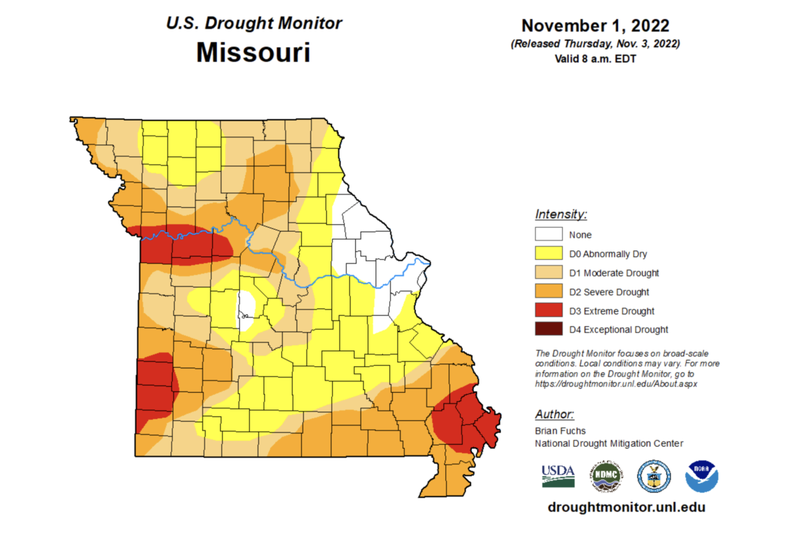
A story about drought in Missouri includes a map (see below) with a clear legend and a helpful caption.
DON'T DO THIS
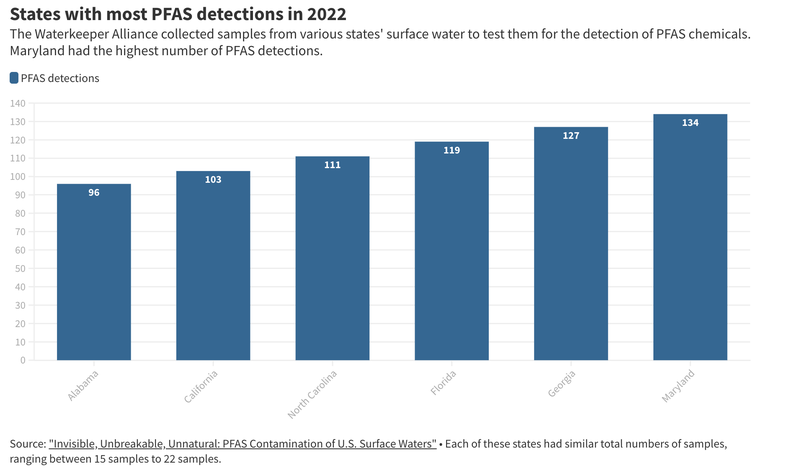
A story about polluted waterways includes a graph (see below) with captions and axes that fail to adequately explain what is being measured, or what the significance of those measurements is.
DISCUSSION
A story about polluted waterways includes a graph (see below) with captions and axes that fail to adequately explain what is being measured, or what the significance of those measurements is. There's no way to tell how many detections is good or bad, or what would be considered normal or average compared to states across the country.
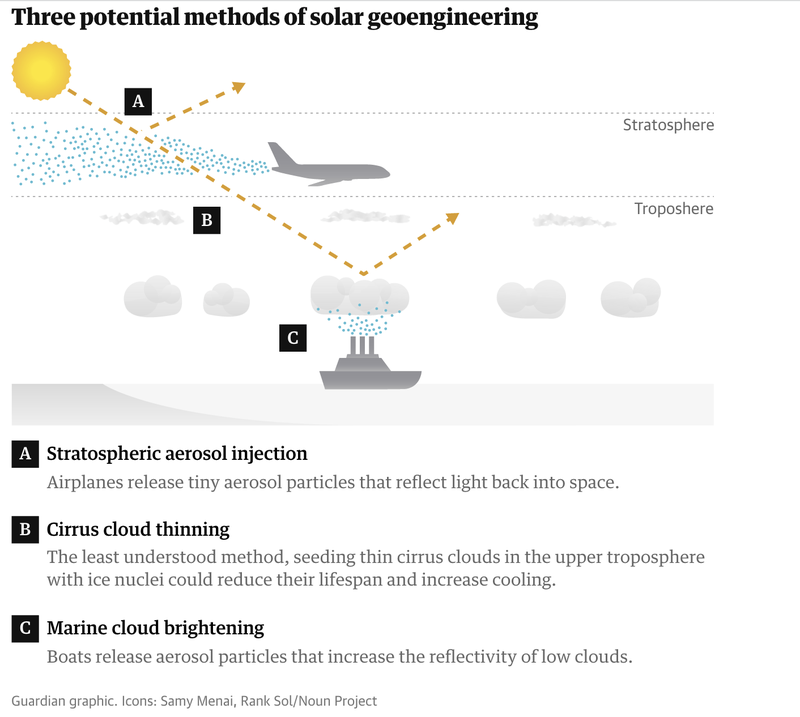
5) Keep things simple. Don’t overload graphics with too much data.
DO THIS
An article about solar geoengineering scenarios includes a graphic (see below) that clearly illustrates three different ways of doing this.
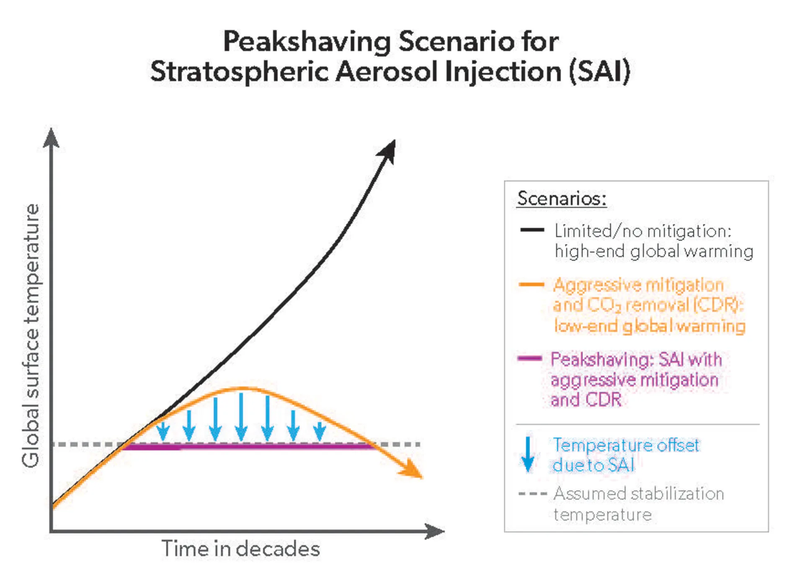
DON'T DO THIS
An article with the headline “One simple graph shows why we need to study ways of reflecting sunlight to cool the Earth” includes a graph (see below) that attempts to simultaneously predict four different solar geoengineering scenarios.
DISCUSSION
Graphs, charts, and other kinds of data visuals offer an incredibly powerful means of making complicated climate data comprehensible. But in order to do this successfully, it’s important to not overload these graphics with too much information. While scientists can probably interpret the second graph (which comes from a document prepared by the World Meteorological Organization), general audiences would likely struggle to grasp what is happening here. Neither would they be able to understand text, such as “SAI with aggressive mitigation and CDR.” The first example offers a much more legible, user-friendly explanation of solar geoengineering.
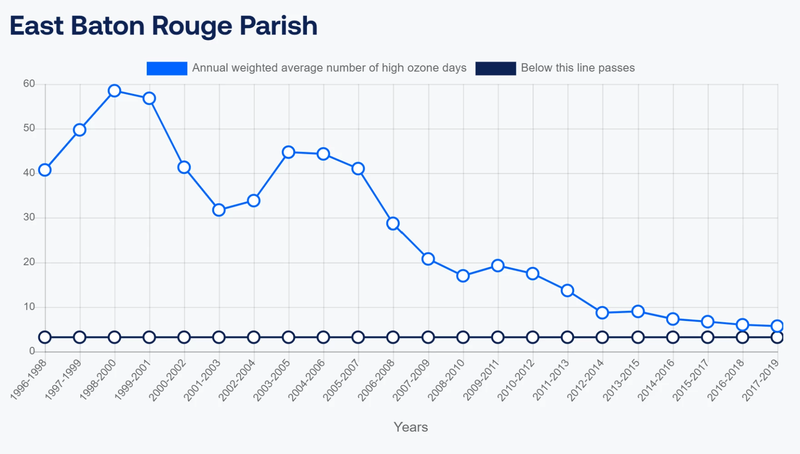
6) When possible, show changes over time.
DO THIS
An article on air quality in Louisiana includes a graph with data on “high ozone days” going back to the mid-1990s.
DON'T DO THIS
The text accompanying a graph (see below) on ozone levels in Connecticut indicates that these “weren’t off-the-charts high,” but does not provide the kind of historical context that would demonstrate this.
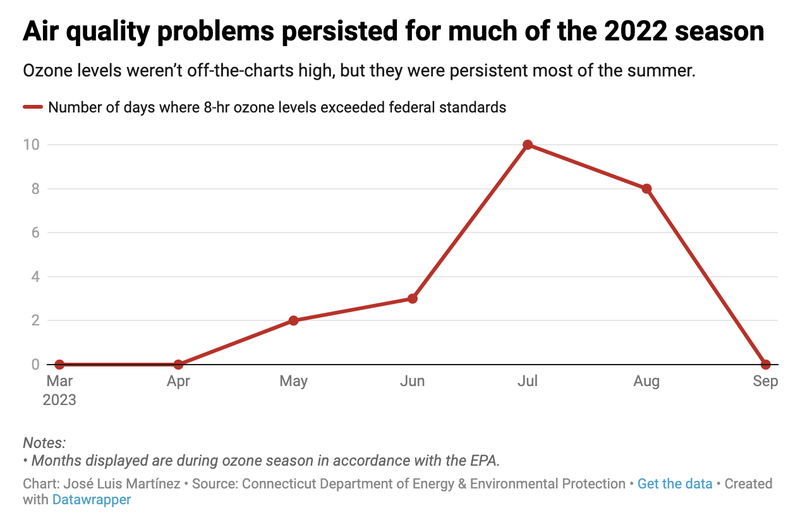
DISCUSSION
Climate change is a long-term historical process, which means that if we want to help audiences understand where we are right now, we need to compare it to where we were before. The first example places data on “high ozone days” in historical perspective, allowing readers to see how air quality has changed over the last three decades. By contrast, the second example includes data for only a single year, which makes it hard to see why ozone levels for 2022 “weren’t off-the-charts-high.” By bringing historical data into the charts and graphics you incorporated into your reporting, you’re giving audiences a baseline for comparing where we are to where we were, which facilitates understanding and promotes critical thinking about climate change. In addition, short-term data can be very noisy; showing longer-term trends can help audiences see patterns that may be challenging to identify when we zoom in too far.
- Previous
- Constructing stories
- Next Section
- Introduction (Economics)